Introduction
The climate data presented in the spatial tool includes the latest climate projection information available from CSIRO for North East Victoria. The tool comprises a series of map and graph based views of changes in climate variables.
Access to Tool
In using this tool you agree to Accept the North East CMA Terms and Conditions for use. (Click here for NECMA Terms and Conditions)
Accept and Access Tool
Regional Climate
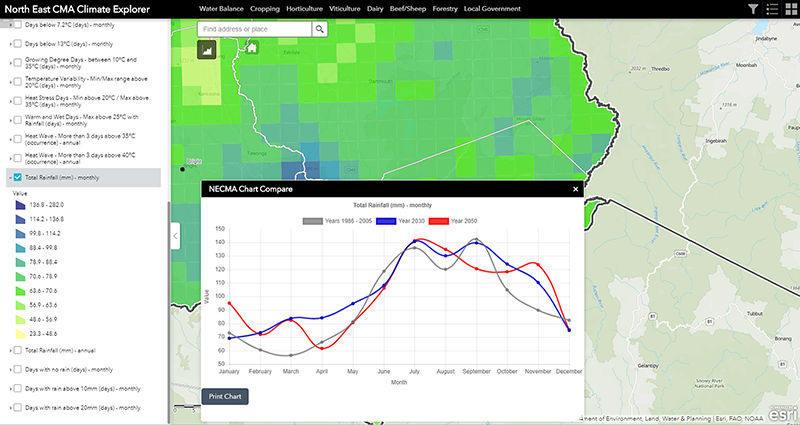
The climate data presented includes the latest climate projection information available from CSIRO. These climate projections are provided for the nominal years of 2030 and 2050 and are based on a baseline (historic) climate period of 1986 to 2005. The climate model and carbon emission scenarios used have been selected based on advice provided by CSIRO on the most reasonable model and scenario to use in relation to the likely future climate for NE Victoria.
The tool comprises a series of map and graph based views of changes in climate variables (such as mean daily maximum temperatures per month, and days per month over a particular temperature). When you commence using the tool by default, the main map view will always initiate with the top layer in the Displayed Map Theme. This will differ between explorer tools, but for the Climate Explorer this will be Mean Monthly Maximum Temperature. And the information displayed will be for the baseline (historic) data, and for the first month (January). You will be able to change the period (to 2030 or 2050), and month, or select another ‘Displayed Map Theme’.
Fact Sheet
A Climate Fact Sheet (in pdf format) can be accessed using the tab below:
Climate Fact Sheet