Introduction
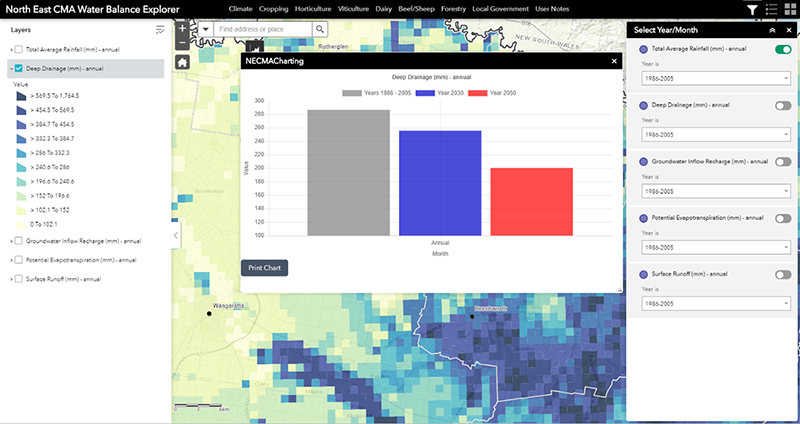
The anticipated impact of climate change on surface water and its availability for agricultural users and the community, is presented in the Water Balance Explorer tool. This tool comprises a series of map and graph based views of likely changes in water balance parameters, such as groundwater recharge, associated with anticipated changes in the climate.
Access to Tool
In using this tool you agree to Accept the North East CMA Terms and Conditions for use.
(Click here for NECMA Terms and Conditions)
Accept and Access Tool
Water Balance
North East CMA catchments are a major supplier of freshwater to the Murray Darling Basin. From a land mass of only 2% of the Murray Darling Basin, it provides 38% of the Murray Darling Basin’s available water for downstream uses, including town consumption and irrigation. Until now there has been a lack of readily publicly available information to inform discussion on the implications of climate change on water resources and downstream climate change adaptation measures.
Water balance modelling using the Catchment Analysis Tool (CAT model) applied over the North East CMA region was made available for this project. Only the surface components of the CAT model have been used for this project and reporting linked surface-groundwater CAT modelling will be an important next step. The five views in the water balance component of the Spatial Tool, which are all annual data views expressed in mm, are:
- Total Average Rainfall
- Potential Evapotranspiration, which is the maximum amount of water potentially available for plant growth.
- Runoff, which is the water which flows over the land surface and can be used as an indicator of potential inflows to farm dams and waterways.
- Deep Drainage, which is the water that escapes below the root zone of plants, and is therefore not available for plant water use
- Groundwater Inflow Recharge, which is the water that escapes the root zone and reaches the uppermost groundwater aquifer which directly impacts the watertable depth (noting that not all water that escapes the root zone of plants reaches the groundwater).
When you commence using the tool by default, the main map view will always initiate with the top layer in the Displayed Map Theme. For the Water Balance Explorer this will be the Total Average Rainfall for the baseline (historic) climate data. You will be able to change the period (to 2030 or 2050), or select another ‘Displayed Map Theme’.
Fact Sheet
A Water Balance Fact Sheet (in pdf format) can be accessed using the tab below.
Water Balance Fact Sheet